Reading Progress
0 / 6 sections
PART 1 Why Is the Ocean Rising?

Sea level rise has two main physical drivers. Getting these straight is one of the key goals of this lab — and one of your pre-lab questions. You may be surprised to learn that melting ice is not the whole story.

Driver 1 — Thermal Expansion

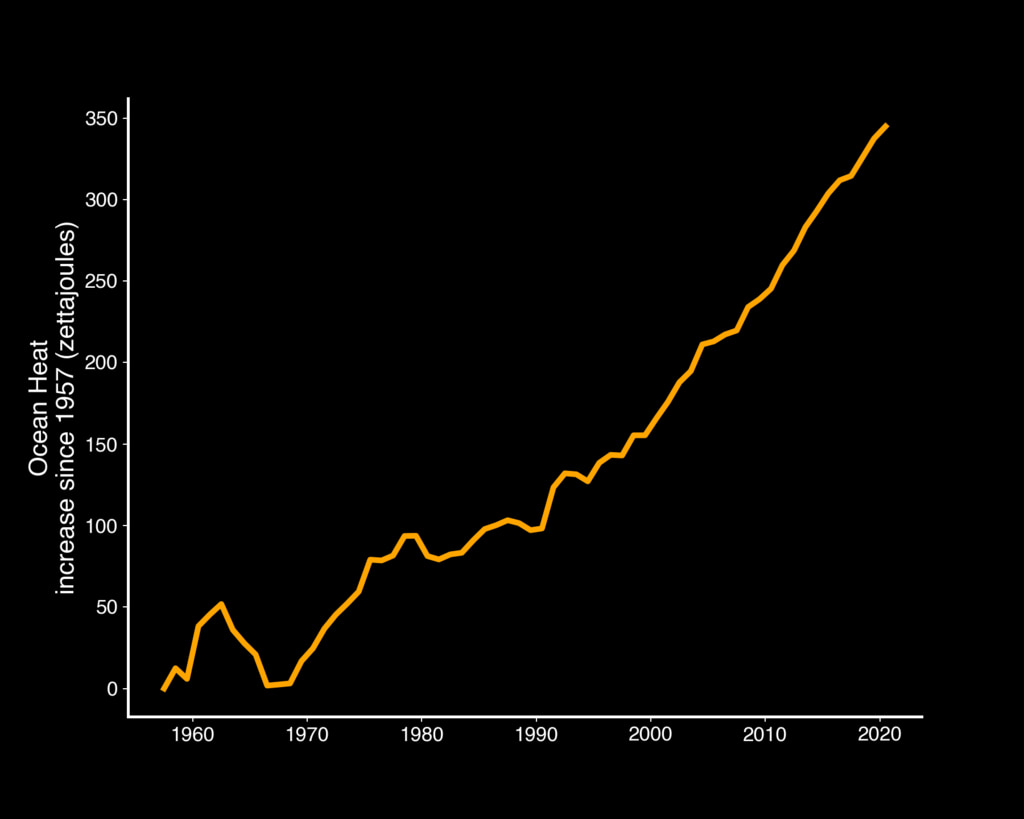
Water, like most substances, expands when it gets warmer. The ocean absorbs roughly 90% of the excess heat trapped by greenhouse gas emissions. As ocean water warms, individual water molecules move farther apart, and the entire ocean physically swells. You don't need to add a single drop of water for sea level to rise — warming alone does it.

This process, called thermal expansion, currently accounts for roughly 40–50% of observed global sea level rise. That's a bigger contribution than most people expect. Even if every glacier on Earth somehow stayed frozen, the ocean would still be rising because of warming.

Key Fact: The ocean has warmed by about 0.13°C per decade since the 1970s. That may sound small, but applied across the entire Pacific, Atlantic, Indian, and Southern Oceans — each several kilometers deep — it produces a measurable and significant rise in sea level.
Photo 1 — Ocean Heat Content
Graph showing increasing ocean heat content over time
Ocean heat content has risen steadily since the 1970s — the energy stored in the ocean drives thermal expansion, one of the two main causes of sea level rise.

Driver 2 — Land Ice Melt

The second driver is the addition of water to the ocean from melting land-based ice. This is critical: only ice that sits on land contributes to sea level rise when it melts. Sea ice (like Arctic Ocean ice) is already floating — it displaces its own weight in water, so melting it doesn't raise sea level. It's the same reason a melting ice cube in your drink doesn't cause it to overflow.

Land ice comes from two main sources:

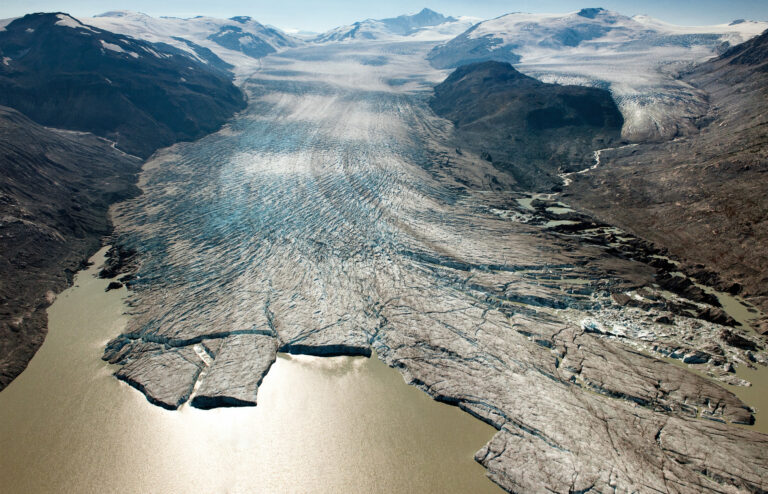
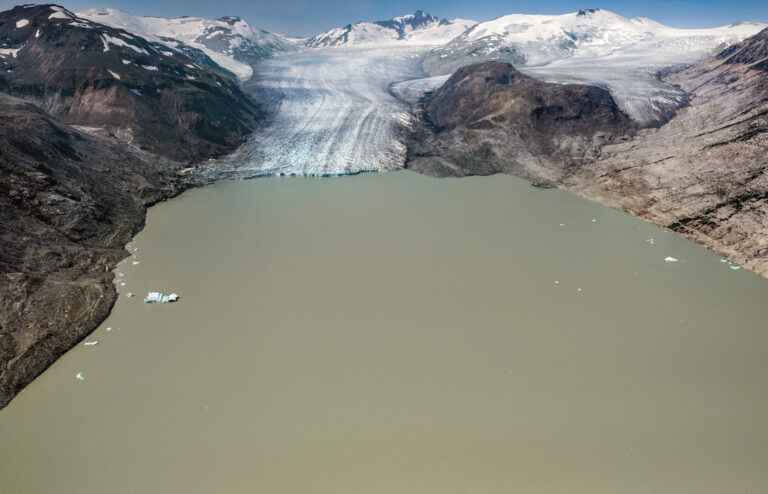
Glaciers and smaller ice caps — found worldwide, from Glacier National Park (Montana) to the Alps, Andes, and Himalayas. These are currently melting rapidly and contribute significantly to sea level rise.

Ice sheets — the massive continental glaciers covering Greenland and Antarctica. The Greenland Ice Sheet holds enough water to raise global sea levels by about 7 meters. The Antarctic Ice Sheet holds enough for roughly 57 meters. These are not going to melt overnight, but even a small percentage of loss has enormous consequences. The West Antarctic Ice Sheet is of particular concern because its base sits below sea level, making it especially vulnerable to warm ocean water intrusion from below.

🌍 Example from the Explorer — Miami / SE Florida

Miami doesn't have glaciers, but it is one of the clearest examples of sea level rise already happening. The city now experiences sunny-day flooding — streets flooding not from storms, but simply from high tides. This tidal flooding has tripled in frequency since the 1980s, driven by a combination of thermal expansion and melt from Greenland and mountain glaciers far away in space but closely connected by the global ocean.

Bridge Glacier, British Columbia, September 2009
📅 September 2009
Bridge Glacier, British Columbia, August 2017
📅 August 2017
Bridge Glacier, British Columbia — eight years of retreat visible from the air. This glacier feeds meltwater into the ocean, contributing to rising seas far from the Finger Lakes. Compare the exposed rock (grey) vs. ice (white) between the two images.
Both drivers matter equally. Current IPCC data suggests roughly 40–50% of sea level rise comes from thermal expansion and 50–60% from land ice melt. Both are accelerating as global temperatures rise. In the worksheed pre-lab questions, you need to name both drivers — naming just "glaciers melting" is only half the answer.
PART 2 How Much Rise? Understanding IPCC Scenarios

Scientists don't give a single number for how much sea level will rise by 2100 — because it depends heavily on how much greenhouse gas humanity emits over the next 75 years. To handle this uncertainty, the IPCC (Intergovernmental Panel on Climate Change) uses standardized Representative Concentration Pathways (RCPs) — essentially different "futures" based on different emissions trajectories.

The Coastal Vulnerability Explorer uses four scenarios. Click each one to learn what it represents.

+0.5 m
RCP 2.6 / Low Emissions
This scenario requires aggressive, immediate global action to drastically reduce emissions. Sea level rise is limited because warming is kept under 2°C. This is the target of the Paris Agreement. In practice, current global emissions are not on this trajectory, making it a best-case scenario that requires significant policy change. Referred to in the explorer as the "Low" scenario.
+1.0 m
RCP 4.5 / Moderate Emissions
Emissions peak around mid-century then decline substantially. Some major policy action has been taken but not enough to limit warming to 2°C. This is sometimes called the "optimistic middle ground." Still requires substantial international effort. Many climate scientists view this as a plausible outcome if current policies are strengthened meaningfully.
+1.5 m
RCP 6.0 / High Emissions Business as Usual
This is the "business as usual" scenario — no major new climate policy, emissions continue roughly as today. Warming of 3–4°C by 2100. This is the trajectory the world was broadly on as of the 2020s. Coastal impacts are severe and largely irreversible. Many IPCC scientists consider this the most likely outcome without substantial additional policy action. Pre-lab question 5 asks you to identify this scenario.
+2.0 m
RCP 8.5 / Very High Emissions + Ice Instability
Emissions continue to rise throughout the century — effectively a "fossil fuel intensive" future. Combined with potential ice sheet instability (particularly West Antarctica), sea level rise could reach 2 meters or more. Some components may be irreversible regardless of future emissions. Consequences at this level would be civilizational in scale for many coastal regions.
For Pre-Lab Question 5: The RCP that corresponds to "business-as-usual with no major policy change" is RCP 6.0, corresponding to roughly +1.5 m SLR by 2100. This is the trajectory emissions were broadly following as of the mid-2020s.
🗺️ NOAA Sea Level Rise Viewer — try dialing to 1 m and looking at southern Louisiana or Miami
PART 3 Why Same Ocean, Different Outcomes?

Here's a puzzle: sea level is rising equally everywhere around the globe (with minor regional variation), yet two coasts can respond very differently to the same amount of rise. Why? Because vulnerability is not the same as exposure. Vulnerability depends on several factors beyond simply "how much sea level rise is coming."

Click each region below to see how its geography shapes its vulnerability.

🌴 Miami / SE Florida
🦅 Louisiana Bayou
🪸 Tuvalu
🐅 Bangladesh Delta
🗽 New York / NJ
← Click a region above to see its vulnerability profile

The Four Factors That Shape Vulnerability

1. Elevation. The most obvious factor. A coastal area that sits 0.5 m above the current high-tide mark is directly threatened by +1 m of sea level rise. A city averaging 10 m of elevation has more time. But elevation alone doesn't tell the whole story — read on.

2. Subsidence. Some coastal land is actually sinking at the same time seas are rising — a process called subsidence. In Louisiana, the land is sinking 1–2 cm per year due to sediment compaction, groundwater withdrawal, and loss of river sediment from levee construction. This means Louisiana's relative sea level rise is 2–3 times greater than the global average. Even without any climate change, Louisiana would be losing coastline.

3. Ecosystem buffers. Healthy salt marshes, mangrove forests, coral reefs, and barrier islands physically absorb wave energy and reduce storm surge. A coast with intact buffering ecosystems handles sea level rise very differently from one where those ecosystems have been degraded or removed. We'll explore this in depth in Part 4.

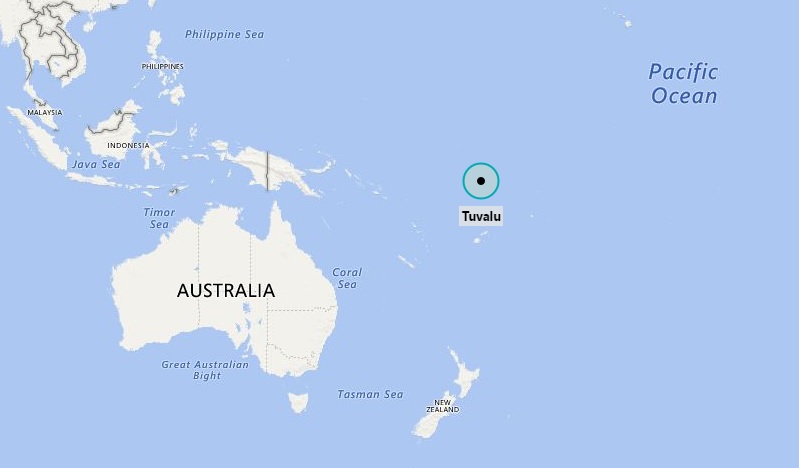
4. Adaptive capacity. A wealthy, technically advanced city like New York can build surge barriers, elevate infrastructure, and install tidal gates. Tuvalu — a small Pacific nation of ~11,000 people — cannot. This "adaptive capacity" means two places with identical physical exposure can have very different social and economic outcomes.

For Pre-Lab Question 4: Two regions with the same average elevation can have different vulnerability because of subsidence, ecosystem buffering, adaptive capacity, and the nature of their infrastructure. Elevation is necessary information but not sufficient to predict vulnerability.
Photo 3 — Louisiana Coastal Land Loss
Aerial view of Louisiana coastline showing fragmented marsh and open water
Louisiana's coast from above — the "Swiss cheese" pattern of open water replacing what was once continuous salt marsh. Louisiana loses approximately a football field of land every hour.
PART 4 Coastal Ecosystems as Natural Defenses

You've already learned about salt marshes, mangroves, estuaries, and wetlands in lecture. Here we're going to connect that knowledge to sea level rise — and to specific places in the Coastal Vulnerability Explorer. The key insight: coastal ecosystems are not just habitats, they are infrastructure. When they are lost, the consequences ripple far beyond wildlife.

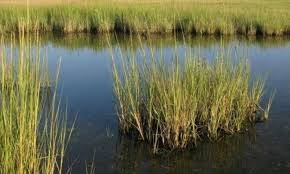
Salt Marshes — New York / NJ: Jamaica Bay

Salt marshes are dominated by salt-tolerant grasses — especially Spartina alterniflora (smooth cordgrass) in North American Atlantic marshes. These dense grass beds are remarkably effective at dissipating wave energy, trapping sediment, and absorbing storm surge. Research has shown that every mile of healthy salt marsh can reduce storm surge by 6–9 inches.

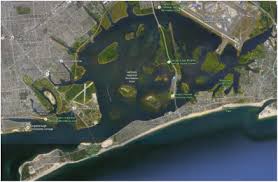
Jamaica Bay, a large estuary within the Gateway National Recreation Area in New York Harbor, is a textbook example of what happens when salt marsh is lost. Jamaica Bay once contained approximately 4,100 acres of salt marsh. By the 2020s, roughly half of that had converted to open water — a loss rate of about 50 acres per year. The causes are complex: sea level rise, propeller wash from boat traffic, reduced sediment supply, and possibly excess nutrients. The result is that the marshes that once buffered Brooklyn and Queens from Atlantic storms are substantially diminished.

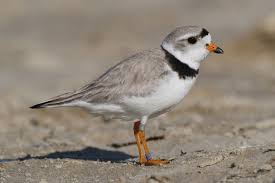
Jamaica Bay also supports a remarkable diversity of wildlife for an urban estuary: over 330 species of birds (including nesting American oystercatchers and laughing gulls), horseshoe crabs, diamondback terrapins, and serves as a critical migratory stopover on the Atlantic Flyway.

Smooth Cordgrass Spartina alterniflora
Smooth Cordgrass
Spartina alterniflora
Dominant grass of Atlantic salt marshes. Its dense rhizome mat stabilizes sediment and its above-ground stems dissipate wave energy. As sea level rises faster than marsh sediment can accrete, these marshes "drown."
Jamaica Bay / NY-NJ
Horseshoe Crab Limulus polyphemus
Horseshoe Crab
Limulus polyphemus
Spawns on sandy beaches adjacent to salt marshes. Their eggs are the primary food source for migrating shorebirds, especially red knots traveling from South America to the Arctic. Loss of marsh shoreline directly reduces spawning habitat.
Jamaica Bay / NY-NJ
Piping Plover Charadrius melodus
Piping Plover
Charadrius melodus
Federally threatened shorebird that nests directly on sandy beach and dune habitat on barrier islands including Fire Island, NY. As barrier islands erode and overwash events increase, nesting habitat is lost and nest success declines.
NY Barrier Islands
Photo 4 — Jamaica Bay, New York
Jamaica Bay showing salt marsh fragmentation and open water
Jamaica Bay, New York Harbor — the dark patches are surviving salt marsh; the open water was marsh within living memory. Over half of Jamaica Bay's original 4,100 acres of marsh has been lost since the mid-20th century.

Mangroves — Bangladesh: The Sundarbans

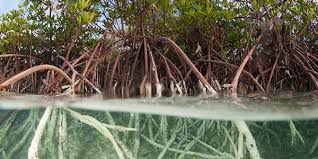
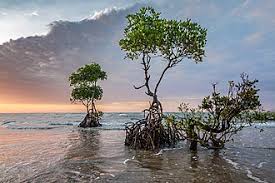
Mangroves are woody shrubs and trees that grow in intertidal zones throughout the tropics and subtropics. Their most distinctive feature is the prop root system — a tangle of aerial roots that creates a physical barrier against waves and traps sediment, actively building land elevation over time. Research from Bangladesh shows that mangrove forests can reduce cyclone wave height by 50–70% compared to unprotected shorelines. Every kilometer of mangrove is worth significant amounts of avoided storm damage — one study estimated mangroves provide over $1 billion annually in avoided flood damage globally.

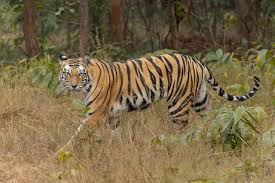
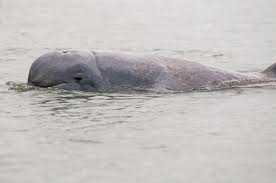
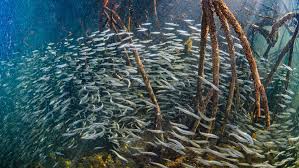
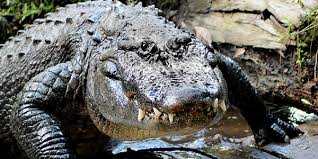
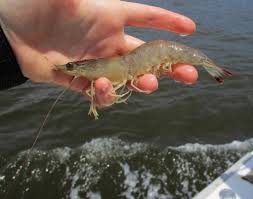
The Sundarbans — shared between Bangladesh and India — is the world's largest mangrove forest (~10,000 km²) and a UNESCO World Heritage Site. It is the primary habitat of the Bengal tiger (Panthera tigris tigris), which has adapted to swimming between islands and hunting in the tidal channels. It also supports Irrawaddy dolphins, estuarine crocodiles, and serves as critical nursery habitat for fish and shrimp that underpin Bangladesh's fishing industry.

As sea level rises, the Sundarbans face a double threat: inundation of low-lying islands and salinization of freshwater areas at the forest margins. The Bengal tiger, which depends on freshwater for drinking, faces a shrinking habitat as fresh groundwater becomes saline.

Bengal Tiger Panthera tigris tigris
Bengal Tiger
Panthera tigris tigris
The Sundarbans population (~100 individuals) is uniquely adapted to a tidal mangrove ecosystem. They swim between islands and drink brackish water — unusual among tigers. Rising seas are fragmenting their already limited habitat.
Sundarbans / Bangladesh
Red Mangrove Rhizophora apiculata prop roots
Red Mangrove
Rhizophora apiculata
Dominant tree in the Sundarbans. Prop roots create a physical buffer against wave action and provide nursery habitat for juvenile fish. The root system actively traps sediment, helping the forest "keep up" with modest sea level rise — but not the accelerating rates projected for 2100.
Sundarbans / Bangladesh
Irrawaddy Dolphin Orcaella brevirostris
Irrawaddy Dolphin
Orcaella brevirostris
A critically endangered dolphin found in the tidal channels of the Sundarbans. Highly vulnerable to saltwater intrusion and habitat loss as the mangrove forest retreats with sea level rise. Also threatened by fishing entanglement and vessel traffic.
Sundarbans / Bangladesh
Mangrove prop roots in water
Prop roots in the intertidal zone
Mangrove forest from above
Mangrove forest canopy
Left: the tangle of prop roots that physically intercepts wave energy and traps sediment. Right: the continuous canopy of a healthy mangrove forest — the same forest that protects Bangladesh's coastline and supports the Bengal tiger.

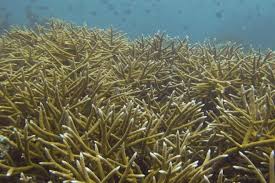
Coral Reefs — Tuvalu: The Reef That Builds the Island

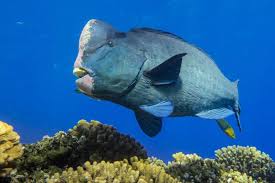
Coral reefs are both ecosystems and physical structures. A healthy coral reef does something remarkable for an atoll like Tuvalu: it produces the sand and sediment that the island itself is made of. Coral skeletons, broken down by wave action and bioerosion (parrotfish grinding coral with their beaks, for example), create carbonate sand that accumulates on the atoll's shoreline and windward reef flat.

If the reef bleaches and dies, this "sediment factory" shuts down. At the same time, the reef framework — the limestone structure that dissipates incoming ocean swell — weakens. Waves that would have been absorbed now strike the shoreline with full force. The result: overwash events increase, the freshwater lens (the only freshwater on the island, sitting like a bubble of fresh water below the sand) gets contaminated with seawater, and the island's physical foundation begins to erode.

Tuvalu's reefs are already experiencing significant bleaching stress from warming ocean temperatures. Combined with sea level rise, the physical existence of the islands themselves is at risk — not just their ecology.

Staghorn Coral Acropora cervicornis
Staghorn Coral
Acropora cervicornis
One of the fastest-growing and most structurally important reef-building corals in the Indo-Pacific. Its branching structure provides critical fish habitat. Also one of the most vulnerable to bleaching — a 1–2°C rise above average summer temperature triggers bleaching within weeks.
Tuvalu / Pacific
Bumphead Parrotfish Bolbometopon muricatum
Bumphead Parrotfish
Bolbometopon muricatum
The largest parrotfish, capable of consuming massive amounts of coral skeleton, which passes through their gut and is excreted as fine white sand. A single large parrotfish can produce hundreds of kilograms of sand per year — the sand that builds and maintains atoll beaches. Overfishing of parrotfish reduces this sediment supply.
Tuvalu / Pacific reefs
Green Sea Turtle Chelonia mydas
Green Sea Turtle
Chelonia mydas
Nests on Pacific atoll beaches including Tuvalu. Sea level rise inundates nesting beaches during high tides, causing nest flooding and mortality of developing eggs. Warmer sand temperatures also increase the proportion of female hatchlings, disrupting the sex ratio over time.
Tuvalu / Pacific atolls
Funafuti Atoll, Tuvalu from the air
Funafuti Atoll from above
Map of Tuvalu islands in the Pacific Ocean
Tuvalu's nine atolls in the Pacific
Left: Funafuti from the air — note how thin the strip of land is relative to the lagoon and open ocean on either side. The highest point on the entire nation is just 4–5 meters. Right: Tuvalu's nine atolls are scattered across 900,000 km² of ocean — the entire landmass is roughly the size of a mid-size college campus.

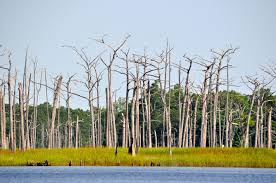
Cypress-Tupelo Swamps — Louisiana Bayou

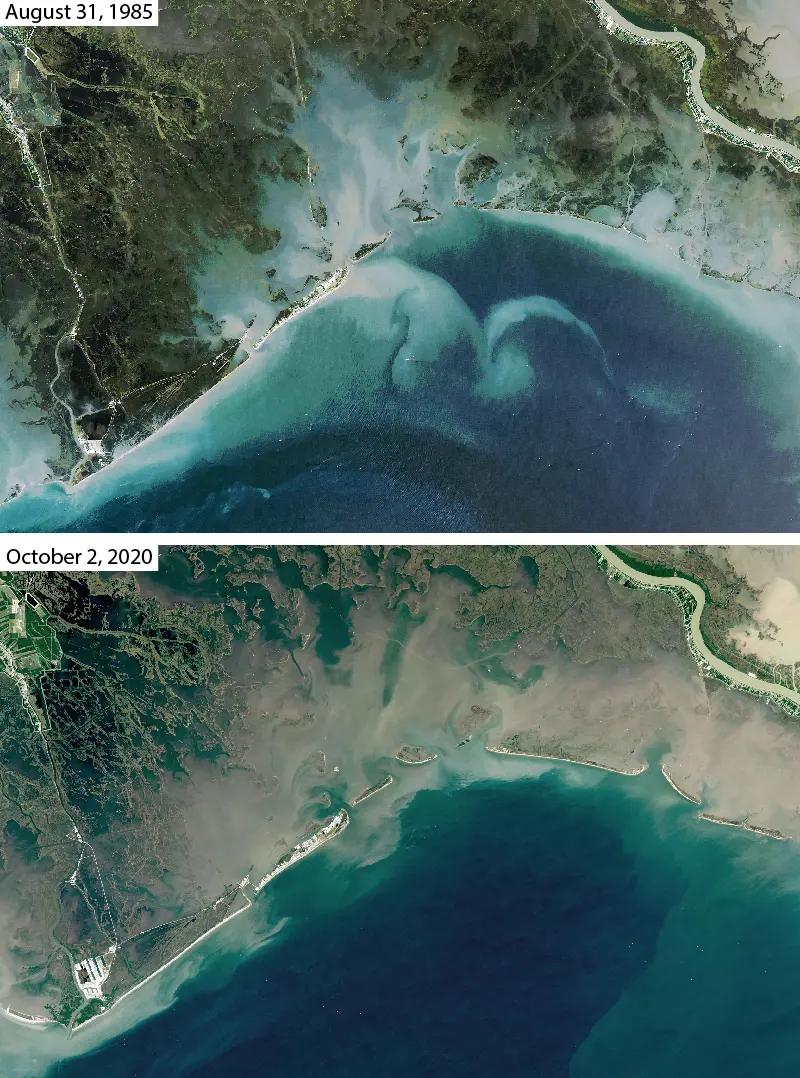
Louisiana's coastal wetlands — a mosaic of cypress-tupelo swamp, salt marsh, and freshwater marsh — function as the coastline's natural storm defense system. Research has documented that every 4 miles of healthy wetland reduces hurricane storm surge by approximately 1 foot. In 2005, Hurricane Katrina's devastation of New Orleans was made dramatically worse because decades of coastal land loss had removed much of that natural buffer.

Louisiana loses approximately a football field of coastal wetland every hour to erosion and subsidence. The primary drivers are: river channelization by the Army Corps of Engineers (which diverts sediment that formerly rebuilt the delta), oil and gas extraction (accelerating subsidence), and sea level rise. This is a compounding problem: less marsh means more storm damage; more storm damage accelerates marsh loss.

Roseate Spoonbill Platalea ajaja
Roseate Spoonbill
Platalea ajaja
One of the most visually striking birds of Louisiana's coastal marshes and bayous. Nests in mangroves and willow thickets along marsh edges. Their feeding behavior — sweeping their distinctive spoon-shaped bill through shallow water — makes them highly dependent on shallow estuarine habitat that disappears as marshes are lost to open water.
Louisiana Bayou
American Alligator Alligator mississippiensis
American Alligator
Alligator mississippiensis
A keystone species of Louisiana's coastal wetlands. Alligator nest mounds — built above water level — provide nesting habitat for over 100 other species. As marshes are converted to open water and salinity increases, alligator habitat contracts. Saltwater intrusion also affects their prey base of fish, turtles, and wading birds.
Louisiana Bayou
Brown Shrimp Farfantepenaeus aztecus
Brown Shrimp
Farfantepenaeus aztecus
Juvenile brown shrimp depend entirely on Louisiana's coastal marsh estuaries as nursery habitat. Without marsh nursery habitat, shrimp populations collapse. Louisiana's $1.5 billion shrimp and seafood industry is built on the ecological productivity of coastal wetlands that are disappearing at an accelerating rate.
Louisiana Bayou
Photo 7 — "Ghost Forest," Louisiana
Dead cypress trees standing in open water in coastal Louisiana
Dead cypress trees standing in open water — the marsh that once supported them has converted to open Gulf. These "ghost forests" are one of the most striking visual records of Louisiana's accelerating coastal land loss.
PART 5 Direct vs. Cascading Impacts: Following the Dominos

The impacts of sea level rise come in two flavors, and distinguishing them is one of your pre-lab questions.

A direct impact is a consequence that happens immediately and directly from sea level rise itself — flooding, erosion, saltwater intrusion into freshwater aquifers. If sea level rises 1 meter and a beach becomes permanently submerged, that is a direct impact.

A cascading impact (sometimes called an indirect or secondary impact) is triggered by a direct impact and flows downstream from it. Cascading impacts are often where the most serious long-term consequences emerge, because they ripple through ecological, economic, and social systems in ways that can be hard to predict or stop.

For Pre-Lab Question 3: One example of a direct impact is saltwater intrusion into a freshwater aquifer. One example of a cascading impact is collapse of a shrimp fishery because nursery habitat (salt marsh) was inundated — the fishery collapse is caused by the marsh loss, which was itself caused by sea level rise.

Tuvalu — Walk Through a Cascading Impact Chain

Here's how a single degree of warming and a meter of sea level rise can cascade into a full civilizational crisis for a Pacific atoll. Click "Next Impact" to reveal each step in the chain.

Starting condition: Ocean temperature rises 1.5°C above pre-industrial average; sea level rises 1.0 m by 2100
DirectCoral reef bleaches and partially dies. Warmer water triggers mass bleaching; the reef framework weakens and stops producing sediment.
CascadingWave energy reaching the shoreline increases. The degraded reef no longer absorbs ocean swell, so full wave force strikes the beach and island margin.
CascadingIsland overwash events increase in frequency. Waves wash across the low-lying atoll during storms and high tides, depositing saltwater across the land surface.
CascadingFreshwater lens is contaminated with seawater. The only freshwater supply on the island — a thin bubble of fresh water sitting below the sand — becomes brackish and unusable.
CascadingTaro crop fields are destroyed by soil salinity. Taro (a dietary staple) cannot tolerate brackish soil and dies. Food security collapses.
OutcomeMass emigration begins. With no fresh water, no food, and no physical safety, Tuvalu's 11,000 residents begin permanent relocation — the world's first climate-driven national displacement.

Louisiana — A Second Example Chain

The same principle applies to Louisiana's bayou country, where land loss creates cascading economic and ecological consequences. Click through the chain.

Starting condition: Sea level rises 1.0 m; no new major coastal restoration
DirectCoastal salt marsh is permanently inundated. Areas that were marsh become open water; subsidence compounds the effect.
CascadingHurricane storm surge penetrates further inland. Without the wetland "speed bump," surge from Gulf storms reaches communities and infrastructure deeper into the coast.
CascadingShrimp and fish nursery habitat is destroyed. Juvenile shrimp and finfish that depended on the marsh estuary lose their nursery — populations crash.
CascadingLouisiana seafood industry collapses. Commercial shrimp, crab, and oyster landings decline dramatically. Thousands of jobs and a $1.5B industry are threatened.
OutcomeCultural and economic displacement of coastal communities. Cajun and Indigenous fishing communities that have occupied the Louisiana coast for centuries are forced inland, with profound cultural loss alongside economic impact.
SELF-CHECK Pre-Lab Questions Practice

These five questions match exactly the pre-lab questions in your worksheet. Answer them here to check your understanding before class. Select an answer for each question.

1. Which two physical processes are the main drivers of global sea level rise?
A. Ocean evaporation and increased river runoff
B. Thermal expansion of seawater and land ice melt
C. Sea ice melting and increased precipitation over oceans
D. Tectonic plate movement and groundwater discharge
Correct! Thermal expansion (the ocean physically swelling as it warms) and land ice melt (glaciers and ice sheets adding water to the ocean) are the two primary drivers. Together they account for nearly all observed sea level rise. Note: sea ice melting does NOT contribute because it is already floating.
Not quite. Sea ice melting doesn't raise sea level because floating ice already displaces its own weight in water. The two main drivers are thermal expansion (warm water takes up more space) and land ice melt (glaciers and ice sheets adding new water to the ocean). Revisit Part 1.
2. A coral atoll (like Tuvalu) and a major coastal city (like New York) both face rising seas. Which would you predict to have a HIGHER vulnerability score, and why?
A. New York — because it has more total economic value at risk
B. Tuvalu — because its low elevation, lack of adaptive capacity, and dependence on living reef make it unable to cope with the same amount of rise
C. They would have equal vulnerability because sea level rise is the same everywhere
D. New York — because it has higher population density
Correct! Tuvalu has much higher vulnerability because it averages just 2–3 m above sea level, has essentially zero financial or technical capacity to build seawalls or surge barriers, and depends on a living coral reef for its physical existence. New York has vast resources to adapt and has higher average elevation. Vulnerability is not the same as total dollar value at risk.
Think about this differently. Vulnerability is not the same as economic exposure. New York has the financial resources to build surge barriers, elevate infrastructure, and adapt over time. Tuvalu's 11,000 residents have no equivalent capacity, and the island itself averages just 2–3 meters above sea level. Revisit Part 3.
3. Which of the following correctly identifies both a direct AND a cascading impact of sea level rise?
A. Direct: shrimp fishery collapse; Cascading: salt marsh inundation
B. Direct: saltwater intrusion into a freshwater aquifer; Cascading: taro crop failure because soil becomes too saline to grow food
C. Direct: greenhouse gas emissions; Cascading: thermal expansion
D. Both are the same thing — any flooding counts as either type
Correct! Saltwater intrusion is a direct consequence of rising seas pushing saltwater into coastal aquifers. Taro crop failure flows from that — the salinity in the soil (caused by the intrusion) destroys the crops. The crop failure is caused by the intrusion, not by sea level rise directly. That chain structure is the hallmark of a cascading impact.
Check the order. A cascading impact always flows from a direct impact — it's secondary. The shrimp fishery collapse (answer A) flows from marsh loss, making fishery collapse the cascading impact, not the direct one. Revisit Part 5 for examples and the Tuvalu chain.
4. Two coastal regions both average 2 meters above current sea level. Why might one be significantly more vulnerable to sea level rise than the other?
A. They would have identical vulnerability — elevation is the only factor that matters
B. The warmer region would always be more vulnerable because it is closer to the tropics
C. Differences in land subsidence, presence of buffering ecosystems, and adaptive capacity (wealth and resources) can make equal-elevation coasts very differently vulnerable
D. The region with more population would always be more vulnerable
Correct! Louisiana and Miami both sit at roughly 1–2 m average elevation, but Louisiana is also sinking at 1–2 cm/year (subsidence), has fewer financial resources for adaptation than Miami-Dade County, and has lost more of its buffering wetlands. Same elevation, different vulnerability. Revisit Part 3 for the full list of factors.
Elevation is necessary information but not sufficient. Consider Louisiana versus Miami — both very low-lying, but Louisiana is also actively sinking (subsidence), is losing wetland buffers at an extraordinary rate, and faces challenges from the oil industry that Miami doesn't. Part 3 lists the four key factors that go beyond elevation.
5. Which IPCC emissions scenario (RCP) corresponds to a "business-as-usual" trajectory — i.e., no major new climate policies are enacted and emissions continue roughly at current rates?
A. RCP 2.6 (Low emissions — Paris Agreement target)
B. RCP 4.5 (Moderate emissions — some policy action)
C. RCP 6.0 (High emissions — corresponds to ~+1.5 m SLR by 2100)
D. RCP 8.5 (Very high emissions + ice instability — worst case)
Correct! RCP 6.0 represents a trajectory where emissions continue roughly as they were trending in the 2020s without major new policy intervention. It corresponds to roughly +1.5 m of sea level rise by 2100 in the explorer. RCP 8.5 is an even more extreme scenario requiring emissions to actively increase, which is considered less likely than current trends.
Not quite. RCP 2.6 requires major emissions reductions (what the Paris Agreement aims for). RCP 8.5 requires emissions to actively increase — more extreme than simply continuing current trends. The "business-as-usual" scenario — no major new action, roughly continuing current emission rates — corresponds to RCP 6.0. Revisit Part 2.
0 / 5
Questions answered correctly
BIO 130 Marine Environment Science · Finger Lakes Community College
Content based on IPCC AR6 (2021), NOAA sea level science, and peer-reviewed coastal ecology literature.
Proceed to the Coastal Vulnerability Explorer to complete your worksheet.